The US tech-heavy Nasdaq index posted its first daily loss in the past 12 days after a furious rally that ended up pushing the benchmark to fresh all-time highs.
The Nasdaq 100 ended the session near its intraday lows at 12,364.6, dropping 2.15% while virtually erasing all of the gains it had delivered during the six days that preceded the downtick.
The 12,295 resistance seems to have served as support during the session, with the stock index bouncing off that level during the trading session while finishing at its lowest levels since the month started.
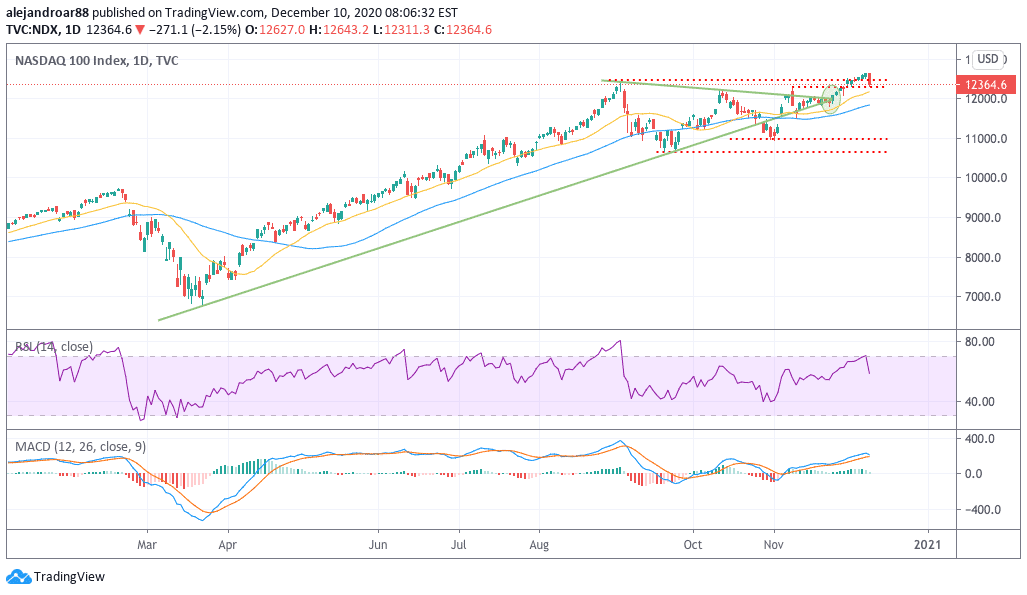
The US tech-heavy index – which tracks companies like Amazon (AMZN), Alphabet (GOOG), Facebook (FB), Microsoft (MSFT), and Tesla (TSLA) – started rallying on 23 November, moving higher after a few days of consolidation signalled by the symmetrical triangle formation shown in the chart above.
A big surge in Tesla shares could have contributed to the latest uptick, as the stock – which accounts for almost 5% of the index’s weight – surged almost 32% since that date, which explains at least 1.8% out of the 3.9% gain the Nasdaq saw during that period.
This latest downtick came exactly after the index touched overbought levels in the RSI, and, up to this point, it seems like a profit-taking move rather than a potential reversal of the latest uptrend.
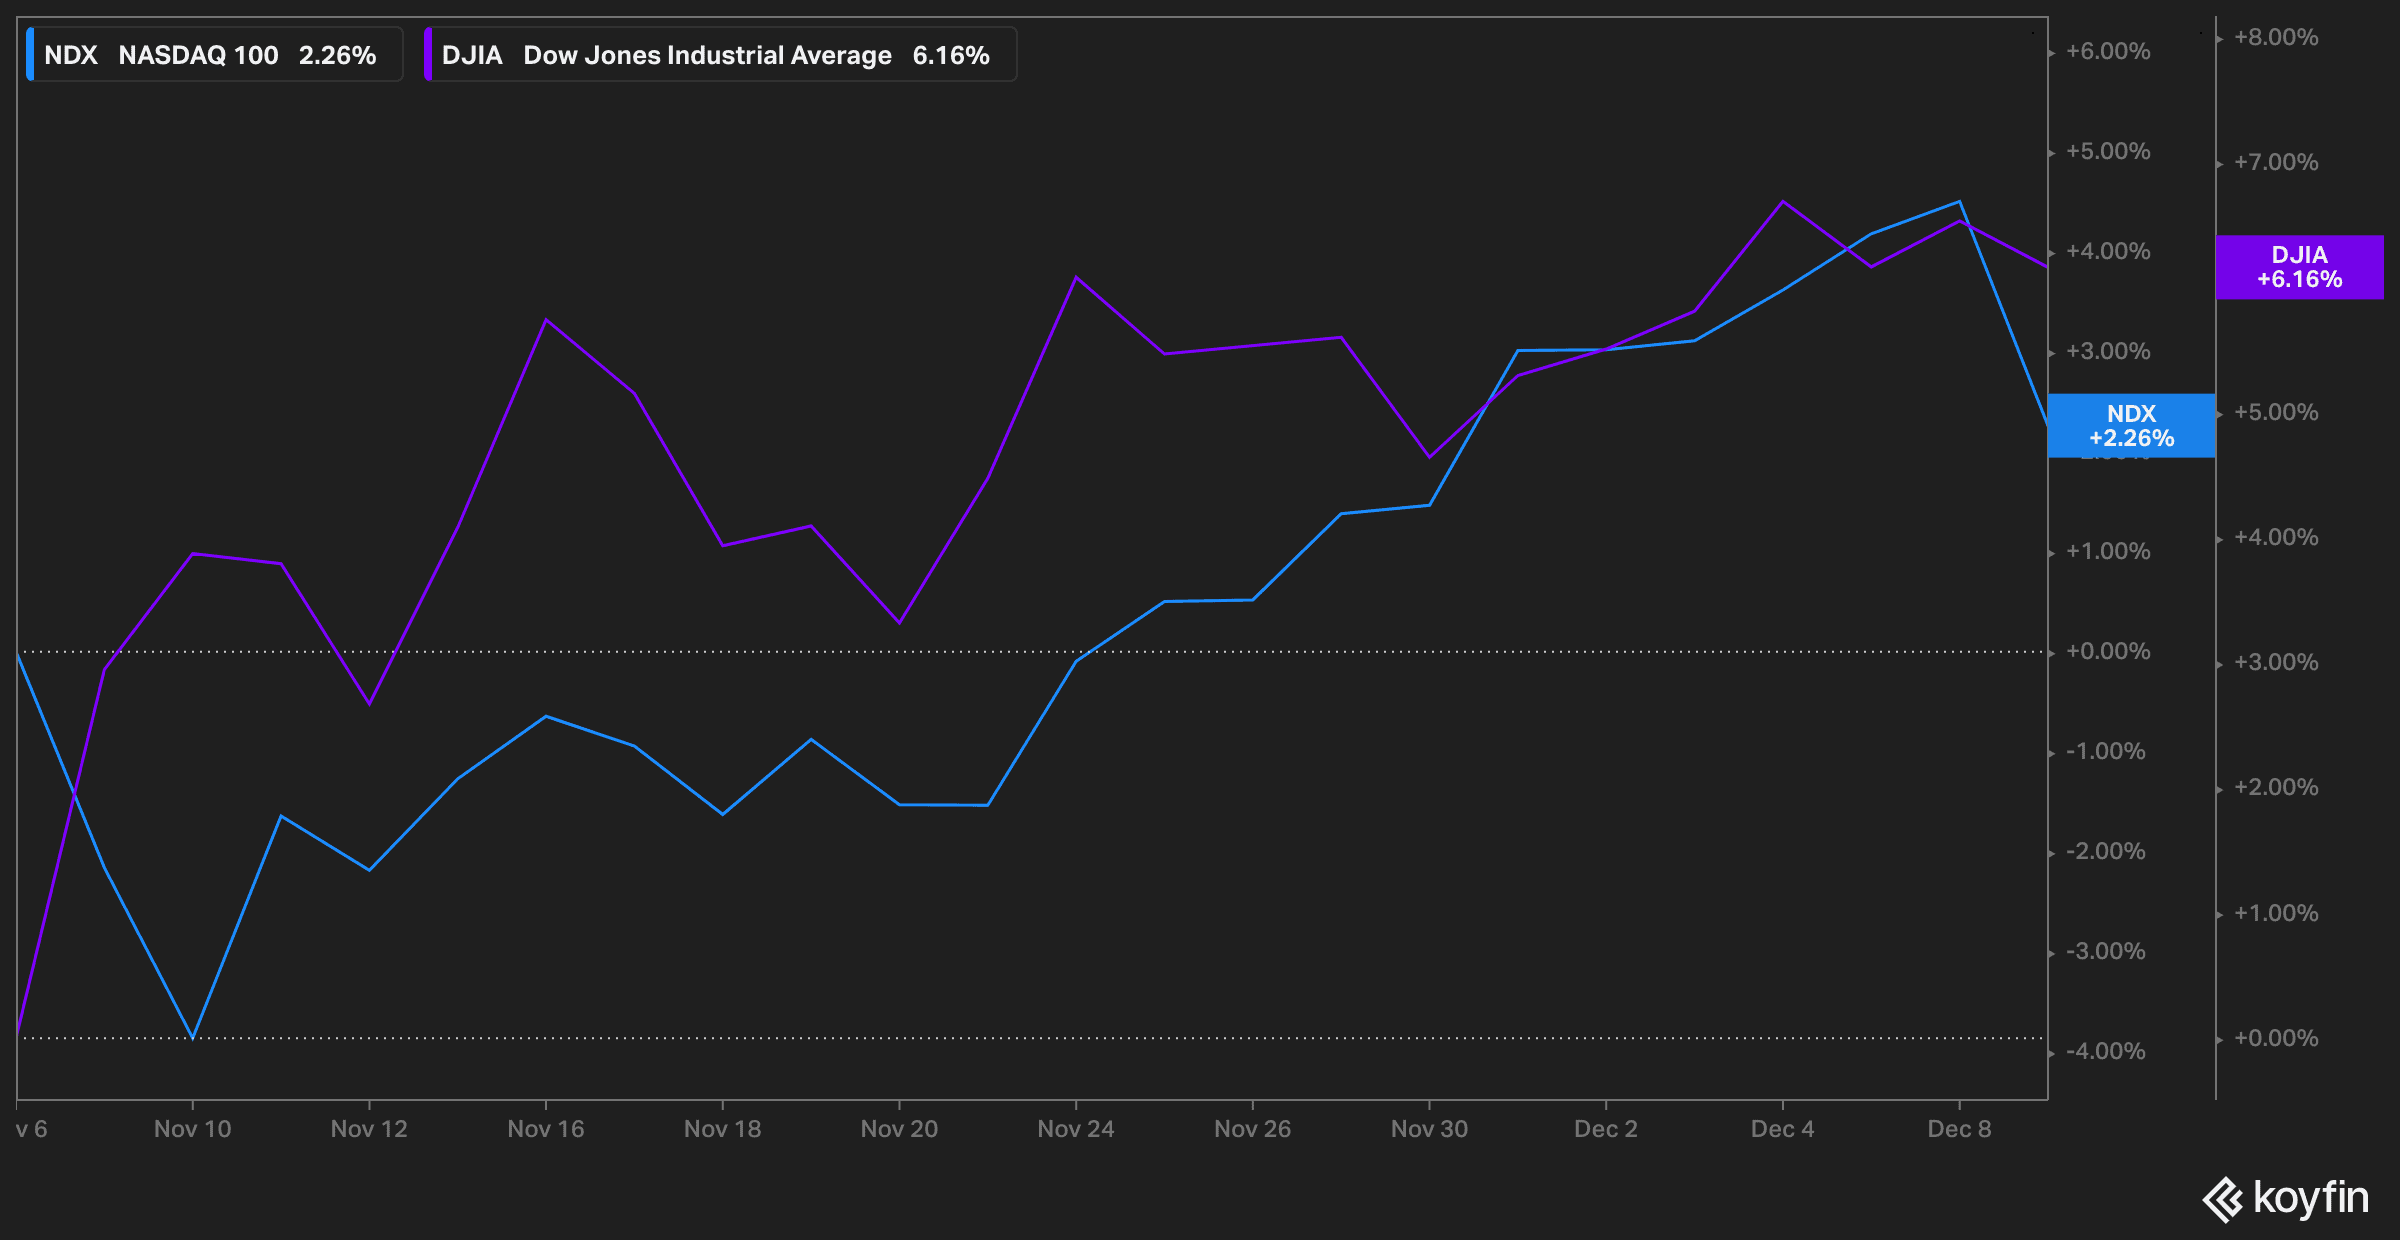
That said, a slighter retreat of 0.35% seen in the more value-focused Dow Jones Industrial Average points to an ongoing sector rotation that started on 9 November, after Pfizer (PFE) unveiled a high level of efficacy from its vaccine – which is now being rolled out in the United Kingdom and Canada and could possibly be approved in the United States before the end of the week.
Since then, the Nasdaq has delivered a 2.3% gain while the DJIA has advanced more than 6% as investors start favouring virus-battered stocks over pricy tech securities.
How have the Nasdaq 100 performed this year?
The Nasdaq 100 index has advanced an eye-popping 42% since the year started, as the pandemic provided a strong tailwind to US-based tech firms amid the restrictions imposed by governments around the world to contain the spread of the virus.
Stay-at-home orders, travel restrictions, and the prohibition of public gatherings have prompted users to rely on technology to work, shop, and entertain themselves while confined within their homes.
This situation has pushed the price of companies like Alphabet (GOOG) – the web-browsing giant – to their highest levels in history, while others like Tesla have benefitted from a growing interest from retail investors who anticipate that a shift towards electric vehicles seems inevitable.
During that same period, the more balanced S&P 500 has delivered a 13.8% gain while the Dow Jones Industrial has remained the laggard among the three, posting a 5.4% gain so far this year while crossing above the 30,000 level for the first time in history.
Where is the Nasdaq 100 index headed now?
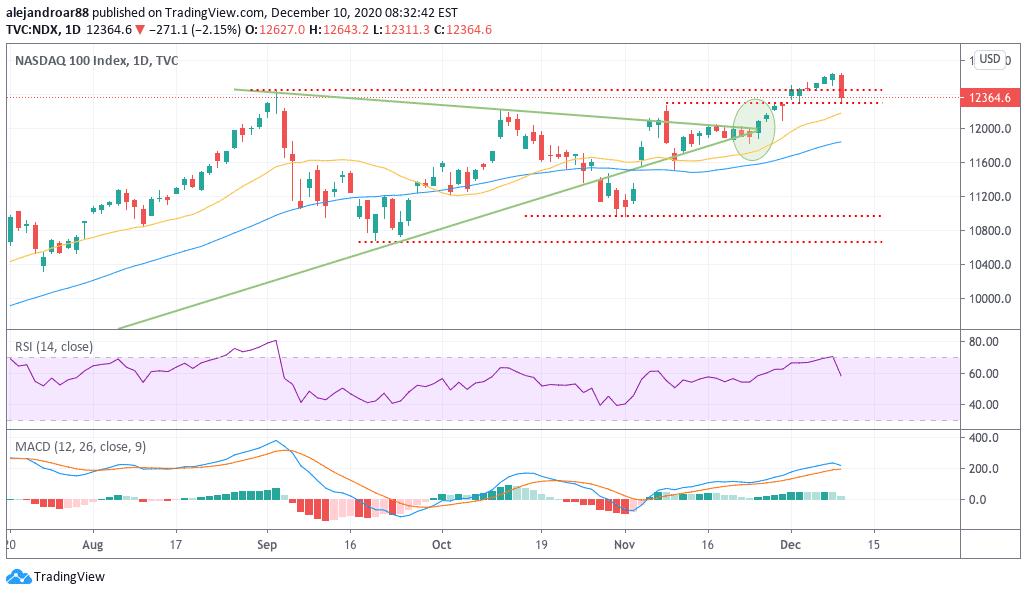
Despite yesterday’s drop, the Nasdaq 100 still has plenty of support levels to fall back on if a sharper pullback were to unfold.
First, we have the benchmark’s 20-day and 50-day moving averages, currently sitting at 12,150 and 11,820 respectively. Then, the 12,000 psychological threshold could serve as a bouncing platform for the index as well, followed by the 11,500 and 10,965 levels, both of which have supported the price action on multiple occasions over the past few weeks.
It is important to note that although a bear market seems to be off the table, a sharp pullback has been widely expected by traders lately as the combination of the rotation trade along with a possibly overheated rally could end up resulting in a short-term drop for the index.
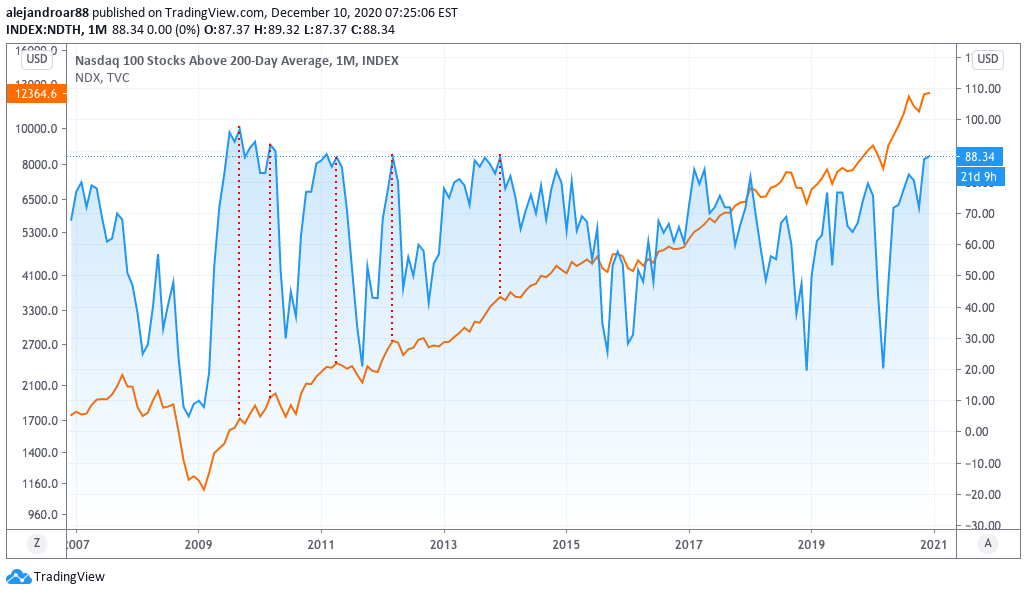
Reinforcing this view, the chart above shows that 88% of the Nasdaq’s constituents are currently trading above their 200-day moving average, a situation that has often been followed by mild pullbacks, although, over the long-term, it indicates that there is significant strength in the stocks that comprise this broad-market index to support further advances.
For now, today’s session will define if this is a one-day pause or if traders are ready to take some more profits off the table as a vaccine starts to be rolled out in the United States territory.

Question & Answers (0)