Spotify (SPOT) shares jumped a staggering 12.6% yesterday to $320.89 per share after the firm unveiled a feature called Wrapped 2020, although there was no meaningful financial driver leading the uptick.
This new feature launched by the audio-streaming company shows a summary of the user’s favorite songs, artists, podcasts, genres, and other picks from the throughout the past year. It will be available in both the web and mobile versions of the app.
Meanwhile, Spotify (SPOT) has also been reportedly trying to recruit Howard Stern – the American radio star – to launch a podcast within the streaming app. However, the consensus is that Stern will keep working with his current employer Sirius XM after being offered an eye-popping $120 million annual contract to stay.
No news has been revealed yet to justify yesterday’s uptick in Spotify shares, a situation that is also reflected in the charts as there was no gap-up in the price action.
Meanwhile, options traders seem to have jumped on board with the move, since there was a highly unusual call buying activity, with a total of 60,000 contracts sold yesterday – 10x the average daily volume – while the number of calls exceeded the number of puts by at least 3 times. Roughly half of that volume was for options expiring tomorrow.
Moves like this often precede a takeover deal or similar market-moving events that may have a deep financial impact on the business, although market chatter has not provided any hints about anything of that nature. Meanwhile, on the technical front, a couple of setups may explain the surge.
How have Spotify shares performed so far this year?
Spotify shares have more than doubled this year – including yesterday’s uptick – with the price moving from $149.55 to as much as $320.89, delivering a remarkable 114% gain for investors during this period.
The audio streaming app has benefitted from the pandemic, with the number of paid subscribers jumping from 124 million by the end of 2019 to 144 million by the end of the third quarter of 2020.
Meanwhile, the firm dived into the podcast industry after landing an exclusive deal with American comedy star and martial arts commentator Joe Rogan, with a contract that reportedly pays the content creator $100 million for the right to distribute his podcast exclusively through the app.
The platform made a similar deal with TV celebrity Kim Kardashian West, who reportedly signed a contract to produce a podcast for the app as well, although the financial details of that deal were not disclosed.
What’s next for Spotify shares?
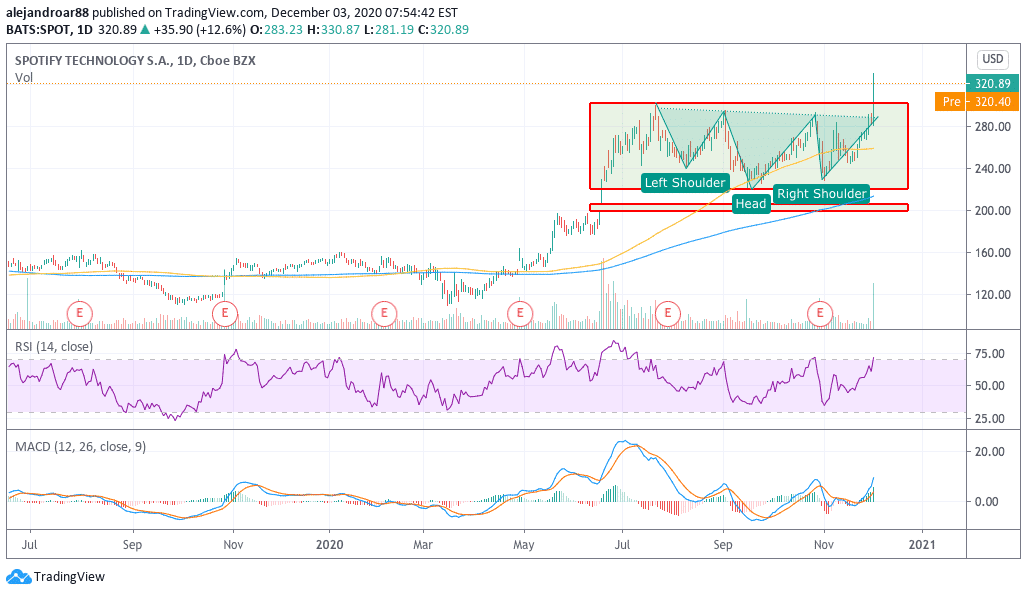
Spotify shares have exploded after completing a bullish inverse head and shoulders (H&S) pattern with a plausible neckline at the $295 level.
Apart from this, the stock has been in consolidation mode for at least four months, with the price hovering between $220 and $300 during that period.
Yesterday’s uptick has successfully broken above this resistance, while it has also confirmed the inverse H&S pattern, which means that a sustained bull run could come over the next few weeks as late buyers start to show up.
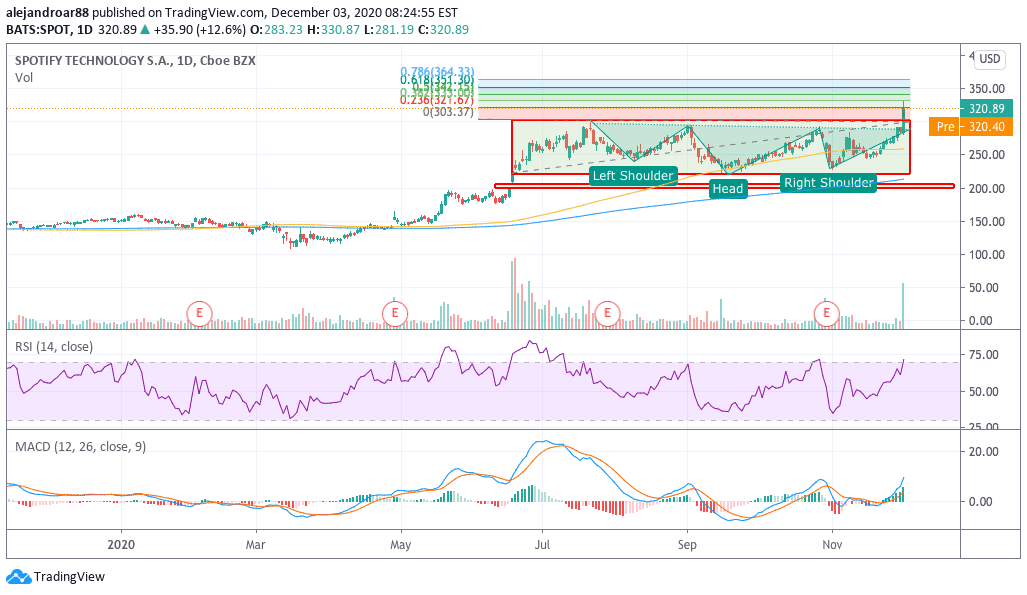
The $300 mark should remain a key level to watch at this point as it could serve as support if a brief pullback takes place over the next few sessions, while an initial target could see the stock surging to the $350 level based on a trend-based Fibonacci projection.
To reinforce this target, the chart above shows how the two first staircases of the Fibonacci extension served as resistance during yesterday’s surge.

Question & Answers (0)