Gold prices are surging for the seventh consecutive day as US Treasury yields are declining to their lowest levels since mid-February this year as investors appear to be concerned about the potential impact that the Delta variant of the coronavirus could have on the global economy.
The price of gold bottomed on 29 June after a sharp sell-off sent the price of the precious metal in a downward spiral from a previous high of $1,900 per troy ounce to $1,761 for a 7.3% loss.
Meanwhile, the price has bounced since then while it is accumulating a 2.9% increase until today when it is trading 0.52% higher at $1,813 per troy ounce in early commodity trading action.
During that same period, yields of the US 10-Year Treasury Notes have declined steadily from 1.478% to 1.276% as the Delta variant poses a threat to the world’s post-vaccine economic recovery.
“Increased Covid cases, particularly Delta Variants have caused concerns that the economic acceleration will slow”, said Timothy Lesko from Granite Investment Advisors to CNBC this morning in regards to this latest dip in US Treasury yields.
Interestingly, this recent uptick in gold prices has not been accompanied by a weaker US dollar. Instead, the price of the greenback, as tracked by Bloomberg’s Dollar Index (DXY) has advanced 0.42% from 29 June, reflecting strong demand for safe havens amid the uncertainty caused by the new virus variant.
Although multiple vaccine makers including Pfizer (PFE), Moderna (MRNA), and Johnson & Johnson (JNJ) have already stated that their treatments are effective at inoculating individuals against the novel variant, the US Centers for Disease Control and Prevention (CDC) stated that, on average, 25% of the active cases in the country are currently infected with the Delta variant while, in some regions, that percentage goes up to 50%. The CDC deemed the variant as a “hyper-transmissible” one.
Despite the effectiveness of vaccines, investors appear to be concerned about the fact that only 55.1% of the US population has currently received a dose or more of the vaccine as per data compiled by the New York Times, which leaves plenty of room for the Delta variant to affect the pace of the economic recovery due to persisting restrictions and quarantine protocols states could decide to impose to curve the spread.
On the other hand, although gold prices have been bouncing lately, inflows for gold ETFs have slowed in the past few weeks. From April to June, the top two gold ETFs displayed net inflows of $711 million according to data from ETF Database. However, July has started with negative influxes of almost $470 million for the two funds, possibly as a result of the sharp downtick that gold experienced since mid-June.
What’s next for gold prices?
The latest bounce in gold prices has been insufficient to push the performance of the precious metal to positive territory this year as it remains 1.1% below its 31 December closing price. Meanwhile, Lower Treasury yields should continue to contribute to pushing gold prices higher but it remains uncertain for how long this latest downtick will last.
According to analysts from Wells Fargo, the 1.25% level could be the line in the sand for asset managers as a move below could trigger concerns about potential underlying issues in the marketplace.
“A sharp drop below 1.25% could cause equity PMs to believe that something is wrong or broken. As a result, we see a growing possibility of a 5% selloff in equities before earnings season”, said Christopher Harvey, the head of equity strategy for Wells, about the current outlook for the equity market.
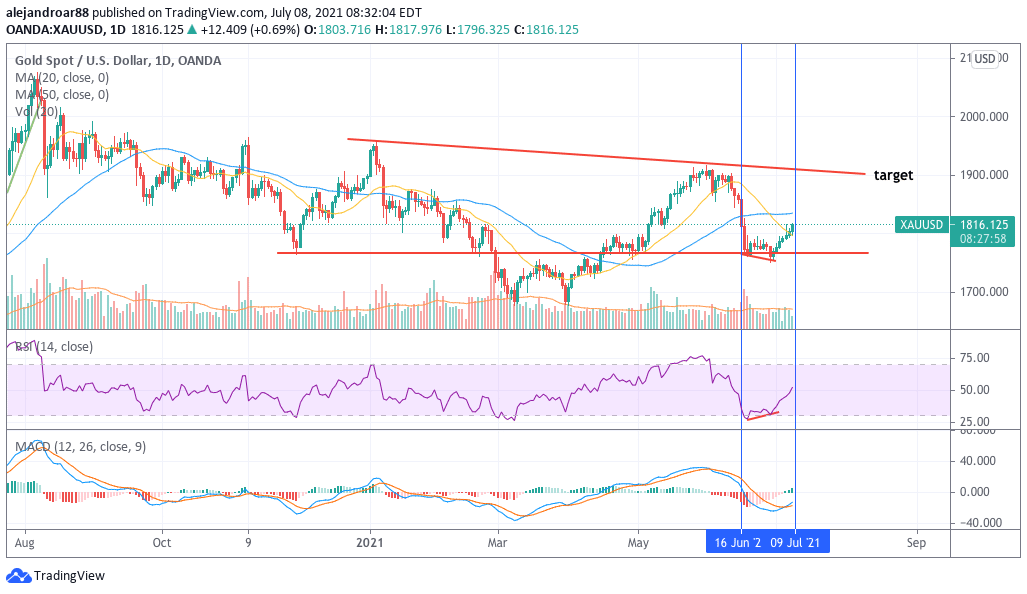
Meanwhile, from a technical standpoint, the latest price action seen in spot gold prices shows that the precious metal has bounced off a key support found at the $1,760 level that has served as a floor for the precious metal at least five times in the past 7 months or so.
Moreover, the RSI shows that this latest rally started on the back of a bullish divergence in the oscillator as it made a higher low despite the price plunging to a lower low. Additionally, the MACD has just sent a buy signal and, even though the indicator is neck-deep on negative territory, these signals tend to precede further upturns in the price of securities.
All in all, the short-term outlook for gold appears to be bullish amid a possibly overheated equity market and the risk of the Delta variant possibly slowing down the world’s post-virus economic recovery.

Question & Answers (0)