Oil stocks are moving higher in pre-market stock trading action this morning following the strong advance seen in crude prices yesterday, with futures of the West Texas Intermediate (WTI) surging to their highest levels since October 2018.
Exchange-traded funds (ETF) covering the space including the SPDR S&P Oil & Gas ETF (XOP) are trading 1.35% higher this morning at $98.50 while shares of Occidental Petroleum (OXY) and Marathon Oil (MRO) are posting similar gains before the bell.
Meanwhile, crude prices are mixed this morning, with WTI oil futures trading 0.92% higher at $75.85 per barrel while Brent futures are retreating 0.13% at $77.06 after surging to their highest levels in more than two years.
Oil prices have been pushed higher in the past few days by an unexpected breakdown in the negotiations carried by members of the Organization of the Petroleum Exporting Countries (OPEC) and its allies – a group also known as OPEC+. The impasse seems to have been prompted by the United Arab Emirates, as the country rejected an initial proposal made by the cartel that involved progressively upping current production quotas by 2 million barrels per day from August to December.
According to sources familiar with the matter, the UAE advocated for a higher quota to ramp up its domestic production during the 18th OPEC and non-OPEC Ministerial Meeting.
Analysts expect that a no-deal OPEC+ meeting would result in all member countries maintaining their July production quotas unchanged for the rest of the year – a situation that would push oil prices higher as demand for crude around the world continues to recover.
However, others don’t share this view and are outlining an entirely different scenario in which oil could collapse if countries go their own way and start to increase their daily output as needed.
This view is shared by former US Energy Secretary Dan Brouillette, who told CNBC this morning that even though he sees the possibility of oil hitting $100 per barrel “very easily”, there is also an “equally possible” scenario in which crude prices could fall down a cliff.
“If there isn’t any agreement on production, and countries tend to go off and do their own thing, or do their own production, you could have a collapse of oil prices”, said Brouillette.
How have oil stocks performed so far this year?
Oil stocks have performed quite well this year, with the SPDR S&P Oil & Gas ETF (XOP) showing a remarkable 67.5% advance since the year started. These gains have helped the fund climb above its pre-pandemic levels even though it is still trading below its 2018-2019’s highs.
Meanwhile, data from ETF Database seems to indicate that the appetite for oil stocks remains high. On the one hand, XOP has reported $233.7 million in net outflows in the past three months. However, other funds covering the sector such as the Energy Selector Sector SPDR ETF (XLE) have reported inflows of $863.8 million during that same period, possibly due to the lowest expense ratio charged by XLE (0.13%) compared to XOP (0.35%).
Many analysts apart from Brouillette have forecasted that oil could hit $100 per barrel this year including a team from Bank of America (BAC), with the financial institution predicting a surge in crude prices resulting from an imbalance between demand and supply.
What’s next for oil stocks?
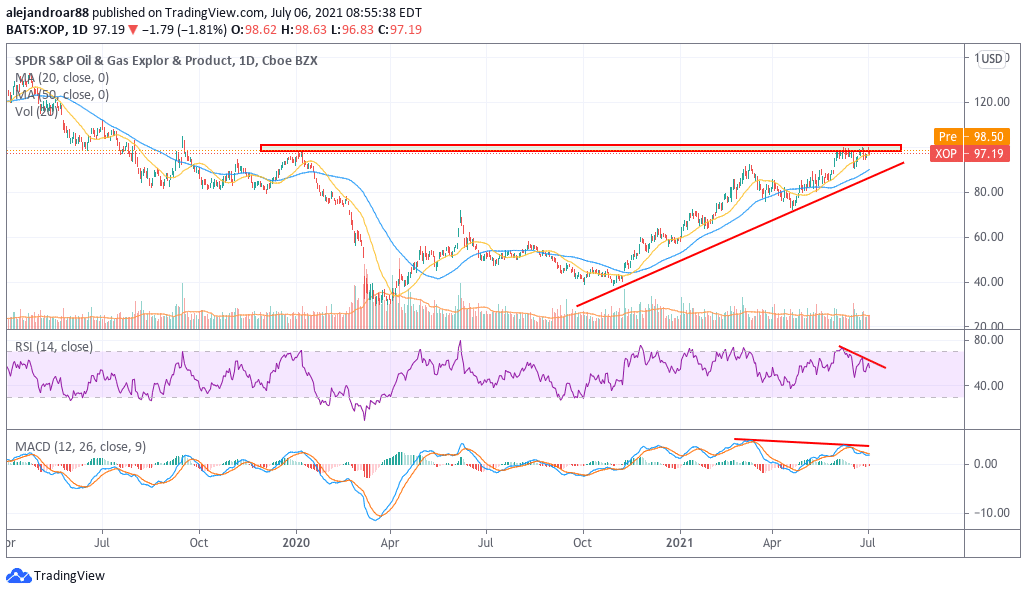
A closer look at the latest price action seen by the SPDR S&P Oil & Gas ETF (XOP) shows that the price of the ETF is hitting a long-dated resistance at the $100 level that could easily prompt the beginning of a new bullish cycle if broken.
There are, however, a couple of worrying divergences in both the RSI and the MACD, as both oscillators have made new lows despite the price of the ETF posting higher highs. These technical signals are reflecting a slowdown in the momentum seen by oil stocks and this means that a reversal of the latest uptrend could take place at any given point. A similar deceleration in momentum readings is also seen in the XLE ETF.
A scenario in which OPEC+ members go their own way to produce as much crude as they want would be the catalyst that could cause this upcoming pullback in oil stocks. Therefore, traders should keep an eye on all OPEC-related news to react promptly if this occurs.
It is important to note that bearish divergences do not necessarily lead to an immediate collapse in the price of a security. However, if prices keep advancing on lower momentum readings, the likelihood of a pullback will increase.

Question & Answers (0)