Negative momentum seems to be slowing for Bitcoin (BTC) as reflected by the price action seen during the weekend while technical indicators appear to be pointing to what could be a near-term bottom for the coin.
The price of Bitcoin managed to advance 2.8% from Monday to Sunday last week while closing the period at $35,677 per coin. During these past 7 days, the coin experienced a sharp single-day drop of 7.3% on Friday but bulls stepped up to buy the dip during the weekend to push the performance to positive territory.
During that same period, the price of Ethereum (ETH) managed to climb 13% although the value of both coins remains significantly below their all-time highs. As of today, Bitcoin is trading 3.3% higher in early cryptocurrency trading action at $36,881 while ETH is advancing 6% at $2,535 per coin.
Increasingly hostile chatter about cryptocurrencies from government officials in the United States and China has weighed lately on the performance of these assets. Last Wednesday, the Chairman of the US Securities and Exchange Commission (SEC), Gary Gensler, highlighted the many risks that investors face when trading crypto assets amid their inherent volatility and stretched valuations.
In a testimony given to the Subcommittee on Financial Services and General Government, Gensler emphasized that there are “many challenges and gaps for investor protection in these markets”. The head of the agency emphasized that tokens are traded through unregistered crypto exchanges while trading volumes and other key market statistics are mostly unaudited.
These comments highlighted the increased attention that cryptocurrencies are getting from regulators amid allegations that the market is used by organized crime to launder money while companies and individuals also resort to crypto assets to evade taxes.
A scary sell-off
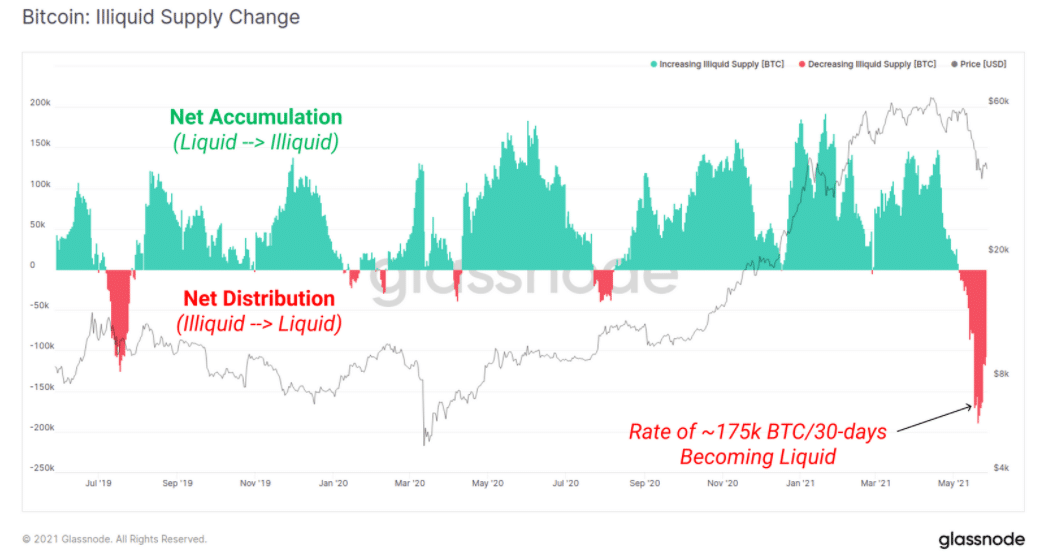
Data from blockchain research firm Glassnode revealed the extent of the sell-off by analyzing on-chain data and, among other findings, the firm emphasized that the move was more than a simple correction as evidence shows that “investors were clearly spooked”.
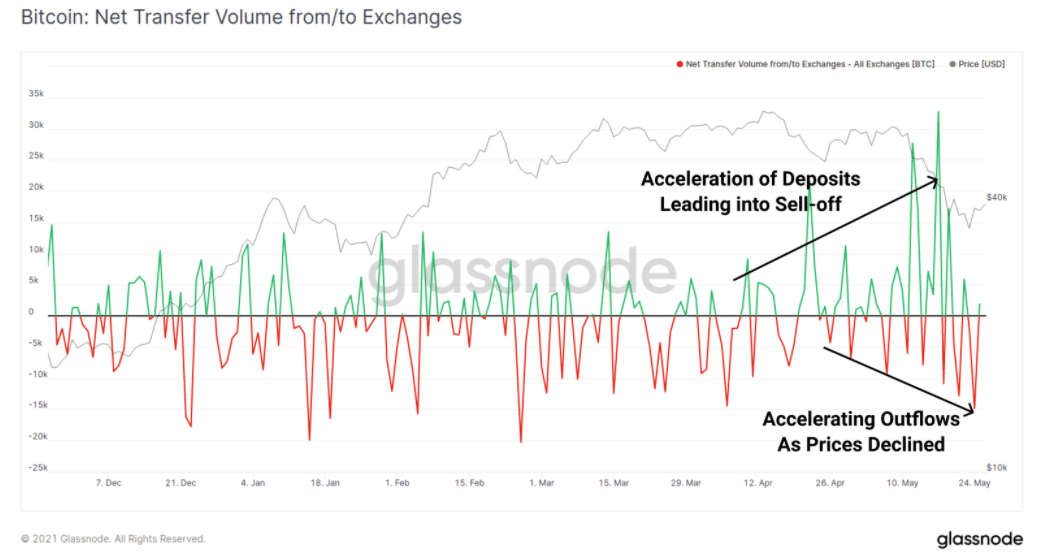
According to the firm’s Insights newsletter, after at least one consecutive year of sustained increases in the volume of illiquid supplies, Bitcoin (BTC) holders moved their assets to exchanges to be able to sell them during the sell-off.

Even though that doesn’t necessarily mean these investors dumped their tokens, it does show that long-term holders were scared by the extent of the downtick.
Meanwhile, from mid-April to late May, large amounts of deposits were poured onto exchanges as the price progressively collapsed from the mid 60,000s to as little as $30,000 per coin at some point.

Moreover, the percentage of Bitcoin held in exchanges showed a trend reversal in late April as it bottomed at around 12.75% to then progressively increase to 13.75% during the worst-days of the sell-off.
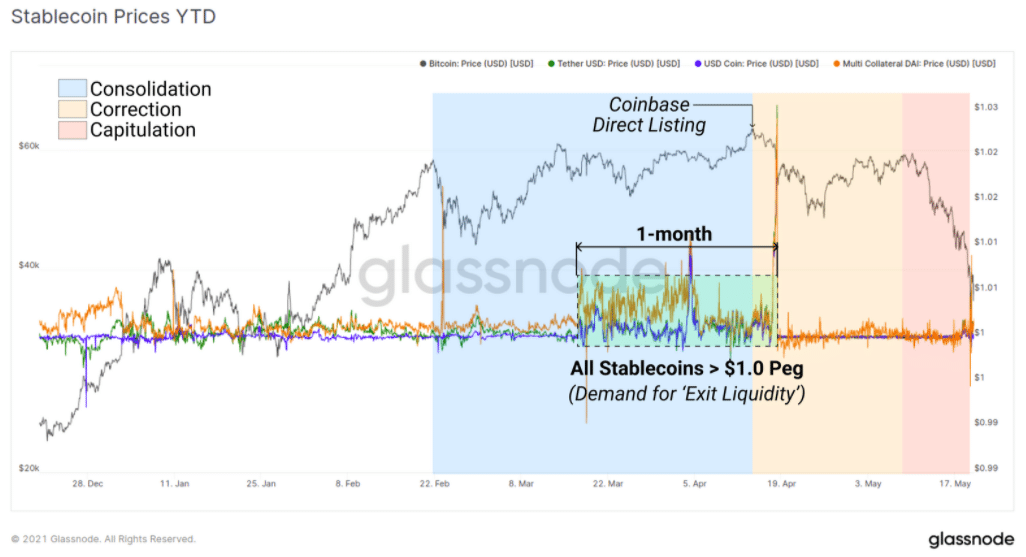
Finally, stablecoins – cryptocurrencies whose value is pegged to the US dollar – traded slightly above their peg during the sell-off as investors rushed to cash out their crypto holdings.

What the evidence presented by Glassnode suggests is that the May downtrend inflicted significant FUD – fear, uncertainty, and doubt – among cryptocurrency traders, possibly due to the combination of many negative catalysts including increased threats of government intervention, taxation matters, and China’s hostile attitude toward the entire ecosystem.
What’s next for Bitcoin (BTC)

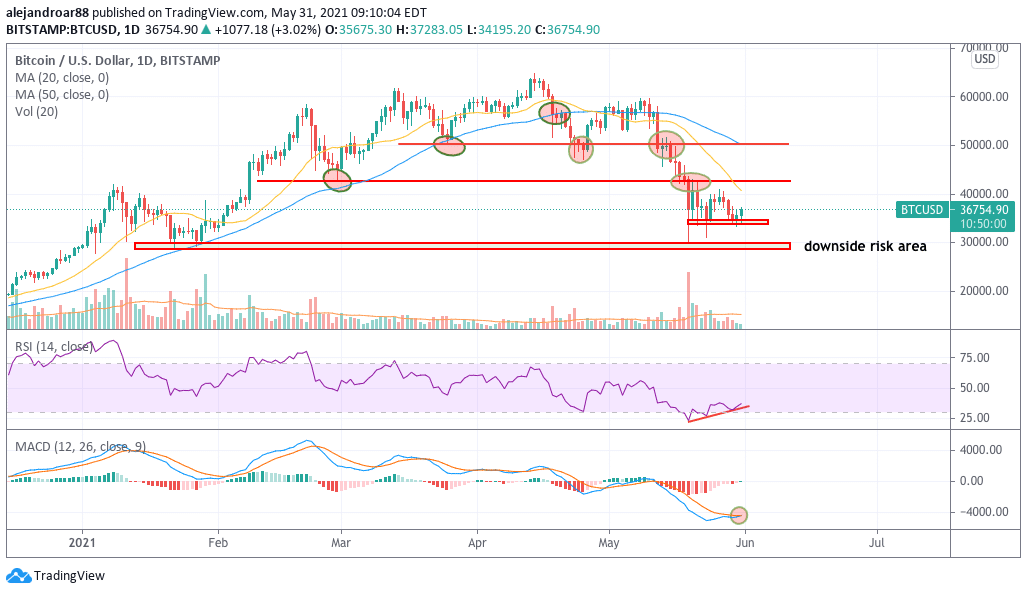
The latest price action seen by Bitcoin (BTC) is already showing signs that the coin may have found its near-term bottom during the weekend as reflected by a bullish divergence in the RSI and an imminent buy signal in the MACD.
On the other hand, it is important to note that trading volumes were not particularly high during the weekend, which means that the risk of another dump continues to exist unless bulls show more conviction in buying BTC at current levels.
For now, if the bullish divergence plays out, aggressive traders would enter a long position at the current price as it has already bounced off the latest lows of $33,500 per coin. Meanwhile, conservative traders could wait until the price breaks above the $40,800 level to get confirmation that the downtrend is effectively reversing.

Question & Answers (0)